TL;DR
A dashboard used to mean a BI tool, a license, and someone to build it. Now you paste numbers into Claude or ChatGPT, describe the views you want, and get a working dashboard in minutes. What AI doesn't solve is the team half: a dashboard is only useful if everyone can open it, trust it's current, and argue about it in place. That's a sharing problem, and it has a clean fix: one live link, comments on the charts, edits without re-prompting, history behind updates.
The build got absurdly easy
The recipe, in full: copy your data (CSV, a table, an export), paste it into your AI tool, and describe the dashboard: "KPI tiles on top, revenue trend by month, breakdown by region, filterable by quarter." Iterate a few prompts, and out comes an HTML page with working charts and filters. No BI seat, no data team ticket, built by whoever owns the question.
For a huge class of team dashboards (the weekly-metrics page, the campaign tracker, the project health view), this genuinely replaces the spreadsheet screenshot that used to circulate. The catch is that AI hands the result to you: one file, on one laptop, and dashboards are the least personal artifact there is. Nobody builds a dashboard for themselves.
Why "team dashboard" fails at the last mile
Run the usual failure modes against a dashboard specifically:
- Sent as a file, it arrives broken or opens as code for the least technical person on the team, who is exactly who dashboards are for.
- Left in the chat, it's trapped in your account; the Monday standup views a screenshot, which deletes the filters, which were the point.
- Numbers update weekly, so any copy-based sharing forks into stale versions immediately. A dashboard whose currency you can't trust is worse than none; people quietly go back to asking you for numbers.
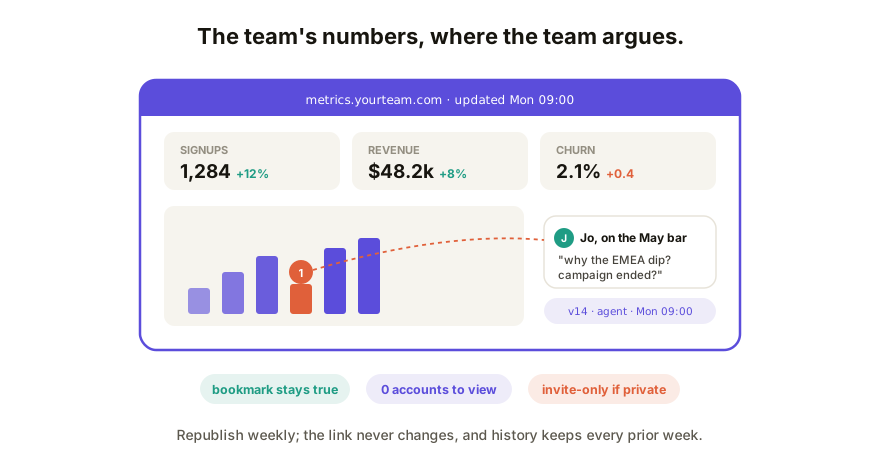
- The discussion happens off the board. "Why did EMEA dip in May?" belongs pinned to the May bar, not lost in a thread (the pinned-vs-thread problem).
The pattern that works
- Build in your AI tool until the views are right. Ask for a single self-contained HTML file.
- Publish it to one live link on a collaboration surface. That URL is the dashboard now: bookmarkable, opens on any device, no accounts for viewers.
- Route the argument onto the board. Teammates comment directly on the tile or chart they mean; the thread about the dip lives on the dip.
- Update in place. New week, new numbers: regenerate or edit, republish to the same link. Everyone's bookmark shows current data, and version history keeps what the board said in any prior week, which is the answer to "what were we looking at when we decided this?"
- Let the owner-of-the-words fix labels and thresholds directly, without prompting anyone.
If the dashboard is client-facing, two more moves: your own domain on the link, and invite-only access, because metrics are usually the last thing you want on a guessable public URL.
Where this stops: the honest boundary
An AI-built dashboard is a snapshot dashboard: data goes in by paste or regeneration, not by live database connection. For always-on pipelines, alerting, and row-level permissions, that's what real BI tools are for, and this pattern doesn't replace them. The sweet spot here is the enormous middle: dashboards updated weekly-ish, owned by non-engineers, where the alternative was never Looker; it was a spreadsheet and a prayer.
How Coedit fits
Coedit is steps 2 through 5: paste the dashboard HTML from any AI tool and get one live link where the team views and comments with zero accounts, discussion pins to the exact chart, updates republish to the same URL with history behind them, and non-coders adjust labels and copy in place. Pro adds invite-only links and your own domain for client-facing boards. Coedit doesn't touch your data or generate the dashboard; it makes the one you built actually function as the team's shared surface.
FAQ
Q: Can I really build a team dashboard with just ChatGPT or Claude? A: For paste-in data updated on a human cadence, yes: charts, filters, KPI tiles, all as one HTML page. What the AI doesn't provide is live data connections or the sharing layer; the first is a real limit, the second is fixable with a live link.
Q: How does the team see updated numbers? A: Publish the dashboard to a stable link and republish when data changes. The URL stays the same, so bookmarks stay true, and version history preserves earlier states for "what did we see last week?"
Q: How is this different from a real BI tool? A: BI tools earn their cost with live pipelines, alerting, and granular permissions. The AI-plus-link pattern covers the far larger set of dashboards that update weekly and were previously a spreadsheet screenshot in Slack.
Q: Can people outside my company see the dashboard? A: Only if you let them. Use view-only links for openness, invite-only links (paid tiers) for metrics, and no-account viewing so invited people don't face a signup wall.